|
Orogenic Andesites
Mexico
(28 data files)
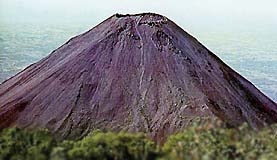
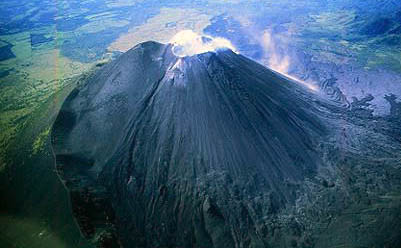
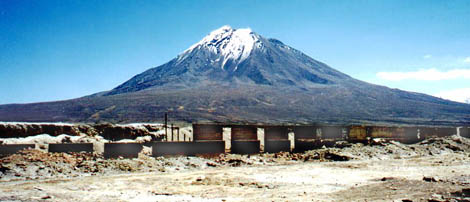
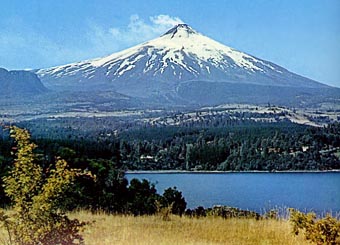
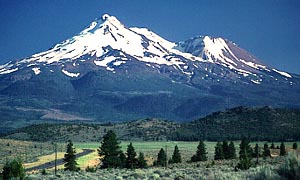
A chain of andesitic volcanoes extends from near Puerto Vallarta in the NW for 600 miles toward Yucatan Peninsula in the south-east, Mexico City being in the approx. centre. An associate Mexican volcanologist, Dr F. Mooser has called this the Trans Mexican Volcanic Belt. It includes 35 recently active centres including Ceborruco, Colima, Jorullo, Paricutin, Popcatatapetl, Orizaba and El Chichon, the latter exploding most disastrously in 1982. The whole 500 miles is studded with small short lived cones like the well known Paricutin, while at the other end of the scale is Popcatatapetl, one of the highest active cones in the world and towering above Mexico, a city of 18 million people. The photo below is rather atypical, usually the upper 5000ft is buried in snow.
 |
Variation diagram for all Mexican Arc data. The high K2O at 8 - 10 % MgO are from the alkali-basalts - basanites found in the region of Durango and Sonora, well behind the arc.
These include lherzolite xenoliths which are compatible with being a source for the arc andesites. See chapter on "Homogeneity of the Earth's Mantle".
|
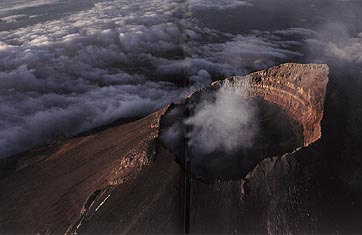
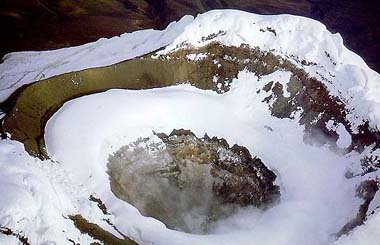
Vent of Popcatatapetl, at 18,000ft, one of the highest active cones in
the world... only miles from one of the largest cities in the world - Mexico City.
Our early studies in Mexico showed a surprising range in type. In the canyon of the Rio Santiago near Guadalajara were half a dozen superposed sheets of massive ignimbrite, sometimes studded with sanidine crystals. Interbedded were thin basalt flows. (Gunn & Watkins, 1970 B.Vol. 34). These basalts proved to be similar to those found 50 miles south in the region of Paricutin, an area of numerous short lived basalt cones including Jorullo. Basalts are also found in the youngest flow of Volcan Xitle in the centre of Mexico City, beside the Universidad de Mexico. (Gunn & Mooser, 1979, BGSA 34).
McBirney et al (1987, C.Min.Pet.95) give the composition of Paricutin, but unfortunately without Nb. However, data from the similar Colima basalts (Verna & Luhr 1993) include Nb and show the expected negative Nb anomaly. Cameron et al, 1989, JGR 94) found similar high-Al basalts in Chihuahua near the US border. Even Minettes have been found, (Luhr & Carmichael, 1989, JGR 94). Even though rhyolitic ignimbrites make up much of the trans-Mexican basement rhyolites are extremely rare in the central andesitic volcanoes. We found a handful of rhyolitic scoria on Tlalapon east of Mexico City, but this was probably crustal material.
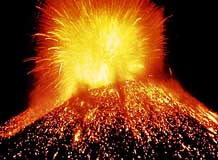
Paricutin began to erupt in 1943, and was
- 33ft high next day
- 550ft after a week
- 1000ft after a year and
- 1353ft after 9 years when it ceased action.
|
|
|
|
|
|
| day |
week |
year |
decade |
Paricutin, (Mexico) in 1943, at night
(Photo: Rittman)
|
Paracutin lies 70 miles S of Guadalajara City and the region is dotted with similar short-lived basaltic cones. The story of how a peasant was plowing a field in 1943 and saw steam rising from the furrow is well known. Flows wrapped around a church five miles away from the vent and then ceased. The local priest was in bad odour as a result as the volcano was obviously out to get him, and he was bitterly asked":
"Why didn't you build your church on the other side of our village!"
While the Trans-Mexican sector show minor regional differences, the K(60) is close to 2 throughout.
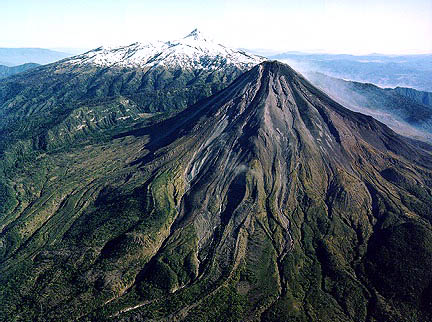
Colima - an active cone towards the western Trans-Mexican Volcanic group.
Photo: Colima Volcano Observatory.

|
Basalts of Volcan Colima |
| Basalts of Paricutin |

|
Volcan Jorullo |
Basement, ie of the region of Paricutin. Probably ignimbrite
(to be checked) |
 |
Eastern volcanoes of the TMVB. |
Central America
(33 files)
Beginning near the Guatemalan border a chain of cones lies parallel to Pacific coast through Guatemala, el Salvador, Nicaragua and Cost Rica. The old Guatemalan capital of Antigua was destroyed when the two opposing volcanoes Fuego and Agua erupted together. V. Pacaya, a little further south is intermittently active and at the present moment (Jan.2000) is firefountaining 2000ft. Arenal in Costa Rica erupted in 1968 gradually building up a huge lava field.
Much of the data for Central America comes from the CENTAM file put together by Rose and Carr. All have trace elements but only a few include REE.
Some of the more basaltic members including the Nejapa and Granada centres appear to be more depleted while others such as Acatatenango, Almolong, Amatitlan, or Aititlan (which overlooks the large lake of the same name in the old Aititlan Caldera in Guatemala) appear more enriched. This is only true in that the latter are more dacitic or even rhyolitic.
As we see in the alkalis/silica diagram below, all Central American volcanoes lie along a similar trend with only minor differences for some elements.
 |
Variation diagram of the Central American arc. (MgO vs oxides) |
The SiO2/K2O diagram shows that the K/60 (ie, the potash content at 60% silica) is about 1.5, lower than most continental andesites, Mexico averaging nearly 2, while some towards the continental interior in Peru and Argentina are as high as 3.5 - 4. Southern Chile however, eg Villarica, Osorno, Puyehue are about the same as Central America.
Volcan Pacaya, Guatemala.
We climbed to the outer rim here in about 1965. A large andesite flow was pouring down towards the Pacific coast. We sat on the rim in thick steam and fume cloud when a sudden phreatic explosion made the whole volcano jump (us as well). To the north we could see volcanoes Agua and Fuego, on each side of the of the old Guatemala capital, partly destroyed in an eruption and abandoned about 200 years ago.
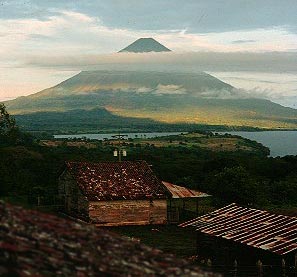
Conception is an active cone seen above Lago Nicaragua.
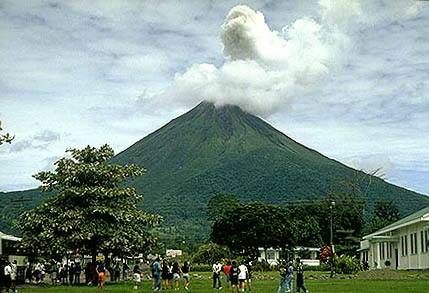
Volcan Arenal, Costa Rica
Photo: Scott Rowland.
The Andean Arc
The Andean Arc stretches from equatorial Ecuador to southern Chile but is divided into four subzones. As well as large numberof active cones (44 within the Central Volcanic Zone from 14 deg to 29S are considered potentially active), there hundreds of others in various states of erosion. The underlying crust (up to some 70km thick) is built of volcaniclastic greywackes and conglomerates intruded by granodioritic batholiths. As could be expected, the range of chemical composition is wide when the whole arc is considered.
 |
All Andesite Series histogram. |
 |
Variation diagram for all Andes data. Andesites have from 2 -4% MgO approx, rhyolites <1% with dacites rhyodacites between. And rock of >8% MgO is likely to be a cumulate block. High K2O rocks are found on the continental side of the main active volcanic chain. Those from the Southern Andes, ie, from Aconcagua to Puerto Monte, are notably lower in LILE, with K(60) of 1.5 or less, a reflection of the thinner crust. |
 |
Variation doagram for the Andean Arc but plotted againsy silica..
Centres of high K2O tend to lie to the east, often over the border in Argentina. Imagine this diagram made up hundreds of trends from different centres, some with (!) 6% K at 60% silica, some with 1.8, some with 2% and so on. |
 |
Zr / Nb Niobium invariably shows a negative anomaly on a multi-element diagrams normalised to mantle or MORB. Nevertheless, Nb can be quite high in the more potassic centres especially, such as Cerro Tuzgle in Argentina. Low Nb is not an invariable indicator of andesitic series rocks. |
 |
La / Lu can also show an unexpected wide range in calc-alkaline arcs. |
(1) The Ecuadorian or Northern Andean Zone
This extends from southern Colombia to southern Ecuador and includes well known cones such as Cotopaxi and Chimborazo and, at the south, Sangay which has been continuously active since 1628.
Sangay. Southernmost active cone in Colombia-Ecuador.
USGS photo.
 |
Sangay has a K(60) of 2.4 compared with 2.0 for Nevado del Ruiz. |
 |
Antisana Volcano, Ecuador (5753m)
Chemically remarkably like Sangay, Antisano is Ecuador's fourth highest peak and lies immediately North of Cotopaxi. The K(60), like Sangay is about 2.5. There are some small differences in slope of trends and in Fe - Ti content. Antisano last erupted in 1802. |
 |
c.f. 1.75 for Galeras (also in Colombia)
|
 |
Nevado del Ruiz, Colombia.
In 1985 a minor eruption caused very large mudflows which destroyed towns where the occupants refused to move ...some 25,000 people were killed.
Pb, Pr, Dy & Y have been interpolated.
|
 The vent of Cotopaxi, Ecuador, (19,400 ft).
Melting of ice by lava causes mudflows, killing 340 in 1877.
|
|
|
Quito, Ecuador, Guaga Pichincha (15,700ft, right) and Tungrahua (16,500ft) were both in eruption in Dec 1999. 20,000 people evacuated. We have no data for these two volcanoes. |
|
 |
Variation diagram for Cayambe volcano, Ecuador.
(Samaniego, P et al, 2005 (J.Pet 46, 2225-2252) |
 |
EMORB diagram for Cayambe volcano, Ecuador.
(Samaniego, P et al, 2005 (J.Pet 46, 2225-2252) |
(2) Peruvian Zone or CVZ
This extends from southern Peru beginning at el Misti overlooking Arequipa into the Northern Chilean Altiplano and includes Parincota (17,000ft) shown below. While not listed as a recently active cone, a remarkably fresh flow from Parincota* has dammed a stream forming a lake on the Altiplano. While we have a good deal of data for major and trace elements from this region including St Pedro-San Pablo, Azufre etc (Roobol et al, 1972) there is little REE data. At the southern end of this zone is Ojos del Salado (22,600ft) which has fumaroles and is taken as the highest active volcano.
*Note: Sometimes called Parincota and sometimes Parinacota.
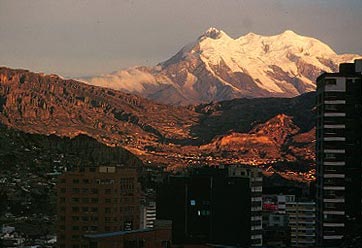
Illimani 21,184ft, an eroded and long extinct cone looms above La Paz in Bolivia.
The Arica-La Paz railway ziz-zags down the escarpment behind the city.
|
Tacora, as seen from Arica La Paz Railway, Northern Chile.
Photo: BG
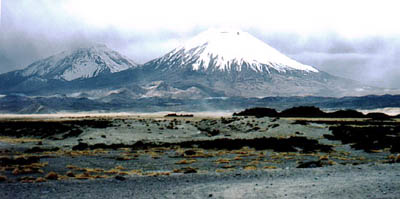
Pomerape (not active) and Parincota, Northern Chile.
Photo: BG
 |
Parinacota. Being about 18,000ft high and sitting with it's associates on top of the Altiplano at 14,000ft, on some very thick crust. Parinacota is quite potassic with a K(60) of 3.0. Rocks range from basalt to dacite. |
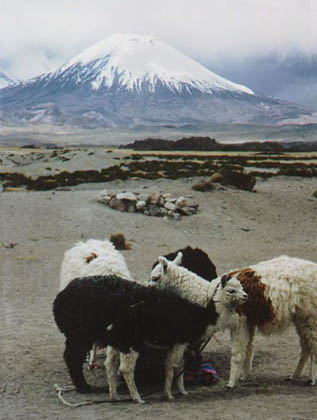
Parincota, Northern Chile.
Photo: BG
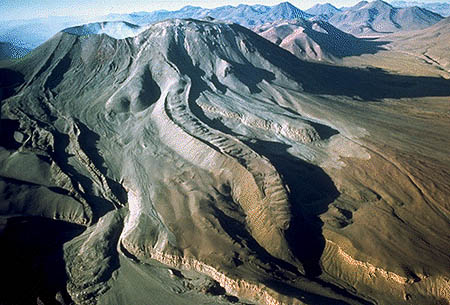 Lascar on the border in the Atacama Desert.
Note the excellent examples of 'Levees' containing the flows.
Photo, P. Francis.
 |
EMORB-normalised plot for Lascar volcano. As the data are incomplete a number of elements including U, Pr, Sm, Eu have been interpolated in order to keep the diagram more or less comparable with others. |
We have no data for many of these volcanoes but an Altiplano Research Station has been set up at Putre a few miles west of Parincota at only 9000ft near Volcan Taachapa.
The remarable extended block and ash debris flows alone are worth a PhD to someone! The altiplano is at 14,000ft, so allow a few days acclimatisation!
North Chile
Along the base of the Andes especially between central and north Chile are great sheets of ignimbrite which have flowed down from vents possibly more along the axis. Ignimbrites (or welded rhyolitic ash flows) form the base of many andesitic chains, as in central New Zealand, or as seen in the Rio Santiago Canyon near Guadalajara, Mexico.
 |
Ignimbrites of Northern Chile. |
East of the Andes over in northen Argentina and further from the offshore trench, there occur some highly potassic andesites, such as Cerro Pocho and Cerro Tuzgle.
 |
Cerro Tuzgle, potassic andesite. K(60) = 3.5 - 4.
|
(3) South-Central Chilean Zone or SVZ
After a gap in north Central Chile, volcanoes are again seen south of the Uspallata Pass and Aconcagua. At intervals we see Tupungato, Volcan San Juan, Maipo, Planchon Petaroa, Campanario, Descabazedo, Azul, Longavi, Copahue, Laima, Villiarica, Osorno, Lanin, Tronador, Cabulco and PuPuyehue. The Campanario is an eroded plug, but the rest are intermittently active. The Andes are a broad dome ridge mainly built of volcani-clastic debris with deep, steep-side valleys cut in the folded greywackes. On top of these are perched the darker, sometimes quite black, volcanoes. In afternoons, trickling meltwater brings down mud and rock chip which forms massive slow-moving mudflows which build fans on the valley floors. They are hell to cross even in a 4 WD. Once we had to wait for hours untill a grader could arrive to clear a temporary track, the mudflow just carried our heavy vehicle sideways.
Planchon-Petaroa.
These two adjacent vents are located only about 50-60 miles SE of Santiago City, Chile. Unlike the Peruvian Altiplano, perhaps because of the much higher rainfall, the Andes are cut into by deep walled valleys, amd on a the broad ridge remaining between Chile and Argentina, are the craters of a series of volcanoes, but only standing up a few hundreds or thousands of feet above the base. Where the cones are on the western margin of the Andes as seen in Villarica or Osorno, they appear much higher.
 |
Villarica, active cone in S. Chile. Lava melts snow and runoff down the gutters shown results in small lahars. Lago Villarica in foreground.

|
 |
High Alumina basalts and andesites of Lanin Volcano, a few miles SE of Villarica. |
| Quetrulipan basalts and andesites. |
Note the lack of -ve TiO2 in the basalts which are at 1.5 times MORB levels.
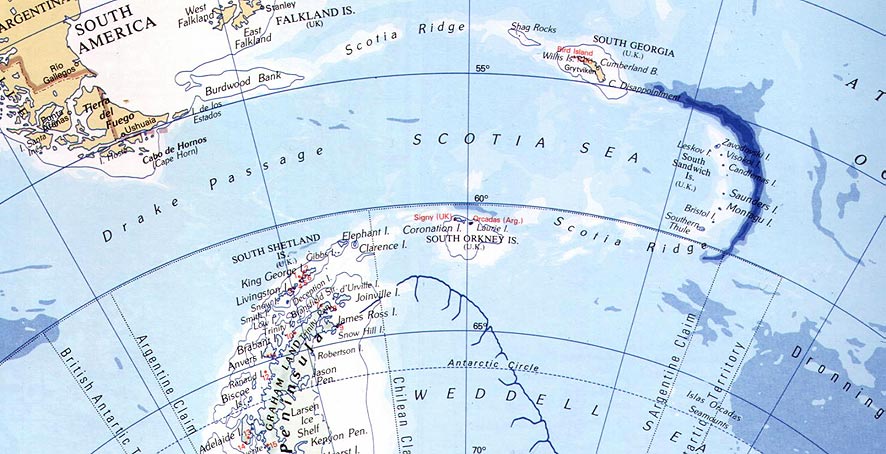
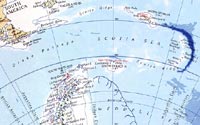
The Scotia Arc
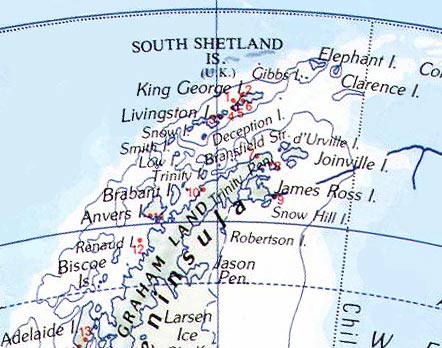
This is a narrow arc, only about 400 miles across, which extrudes like a tongue into the South Atlantic from the Pacific and includes the Drake Passage between Cape Horn on Tierra del Fuego, and the South Shetland Islands off the northern coast of Graham Land.
 |
|
Large map of the Scotia Arc.
|
In the NE is South Georgia, a massive, high, deeply glaciated island of mainly granodioritic plutonic rocks but no active volcanics. Southeast of this are the andesitic South Sandwich Is, including Candlemas, Saunders, Montagu, Bristol, Southern Thule and other islands and skirted to the east by a sharply curving, 6000m deep, trench. On the southern arm recurving towards Graham Land is the Scotia Ridge, then come the South Orkney Is in which lies the well known FIDS base on Signy Island and the nearby Laurie Island. Then westward again come the chain of eroded volcanic islands of the South Shetlands including Elephant Island of Shackleton fame. On the continental side of Livingstone Island in Bransfield Strait, lies the active Deception Id., the whole enclosing the Scotia Sea named after Bruces' ship.
 |
Variation diagram for the varied Scotia Arc, note the different trends from different islands, especially the high soda of Deception Id. |
 |
Na2O and K2O for the Scotia Arc.
Deception Island shows exceptionally high soda, Candlemas Island unusually low K. |
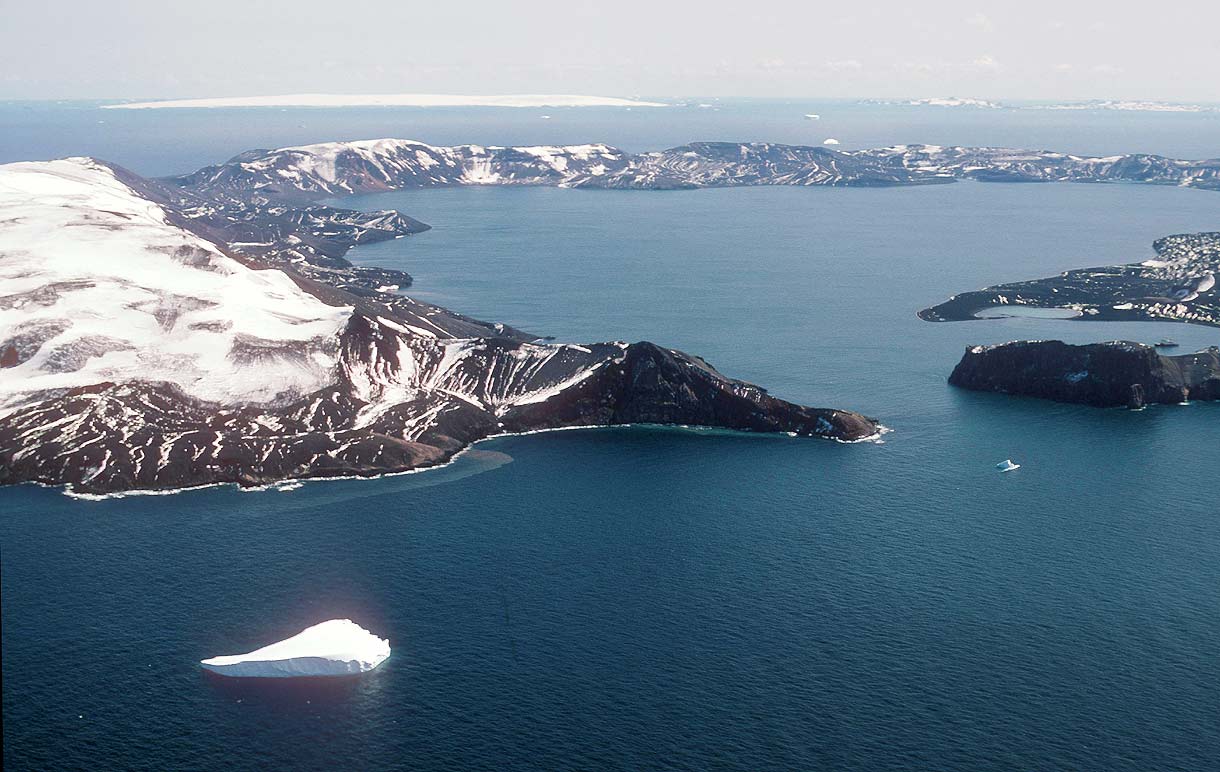
Deception Id
Deception is roughly circular with a deep inner caldera below sealevel which form an excellent harbour with an entrance through Neptunes Bellows. It has been the base for shore whaling and for many expeditions including those of Sir Hubert Wilkins and FIDS (Falkland Is Dependency Survey, now BAS or British Antarctic Survey) among whose ranks I can claim many friends and aquaintances.
 Deception Id seen from air, showing Neptune's Bellows.
Photo: Britsh Antarctic Survey
|
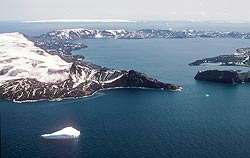 Photo: Britsh Antarctic Survey
|
In August, 1970, Deception erupted throwing scoria out of vents along the caldera marginal fracture, to the alarm of two geologists who had to run.
In 1970, as little data was available, we began a project on the chemistry of Deception Id. It proved to be one of the most sodic of all Early Arc volcanoes with a composition ranging from basalt to rhyodacites with up to 7% soda.
However Dr Peter Baker of Leeds who has published several minor papers on the area, brought out a paper on Deception Id (1975, BAS Sci.Rep.78,1-18) with a larger number of samples to which we could add little so our work (Gunn & Schultz) was not published. However, I still use some of our trace element data, the moral being: always publish.
Keller et al (1991, EPSL 111) brought out data on Deception including some REE but few samples were completed for all elements. Other data for extinct centres in Bransfield Strait including Sail Rock, Bridgeman Id, Melville Peak and Penguin Id, show them to be variable but on average less sodic than Deception. Weaver et al (1979) analysed a better range of elements, for Deception though some show poor correlation. The best data for Deception is probably that of Smellie (pers.Com.) a BAS geologist, (now Director) but some scatter is seen in U, Th and Rb.
However when all data are combined, eg that of Baker (1969), Gunn & Schulz, (1970), Smellie, (pers.com.), Keller et al (1991) and Weaver et al (1979), there is good agreement for most elements though there is some systematic interlaboratory shift, eg in K/Ba, average 7 which is low, the norm being about 10. Altogether, Deception is one of the most unusual of andesite centres.
The K(60) is 1 to 1.15 depending whose data is used, as in the Lesser Antilles but the very high soda, with 4% even in basalts, makes the series plot in the alkaline field on a le Bas diagram. The K/Rb is variously 593 - 611 with the maximum Rb in rhyodacites of 31ppm. Ce/La = 2.51 and La/Sm is regular at 2.6; Zr/Nb = 24.
The Fe and Ti are higher than almost any other andesite series known though they do not plot in the tholeiitic basalt area in a Fe-Mg-Alk ternary diagram. Both Fe and Ti reach a well defined maximum at the TiMt IN point of 4% MgO with 2.5% Ti and >11% Fe, both unusually high for andesites. The high Mg rocks show considerable scatter probably due to the inclusion of cumulate blocks.
|
|
Composite Ternary diagram for Na-Mg-K for Deception Volcano.
+ = Gunn & Schultz (1970, unpub)
x = Baker & Roobol et al, (1975)
* = Smellie, (pers.com)
o = Weaver et al, (1979). (Note slight systematic shift in K) |
 |
Fingerprint Diagram for Deception, (Smellie, pers.com.) |
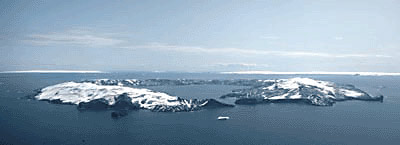
South Sandwich group
Pearce et al (1995, J.Pet. 36, (4) 1073-1109) have done a detailed study of the South Sandwich Islands. This includes of wide range of Proto-arc and Early-arc rocks fairly similar to those of the Izu-Bonin Arc or the Tonga-Kermadec Arc. A total of 160 samples were analysed by XRF and 27 done for REE. Compositions and trends vary widely on the different islands made more distinct by the unusual number of dacites and rhyodacites present.
Candlemas Island is the most depleted proto-arc basalt to dacite series with a K(60) of only 0.35, one of the lowest known. Though Candlemas has 1.5% less soda than Deception its Na-K ratio is even higher. It also has les than half the TiO2 of Deception. Vindication appears to similar but lacks andesites-dacites.
 |
Fingerprint of Candlemas proto-arc series basaltic andesites. Dacites though present are not included. |

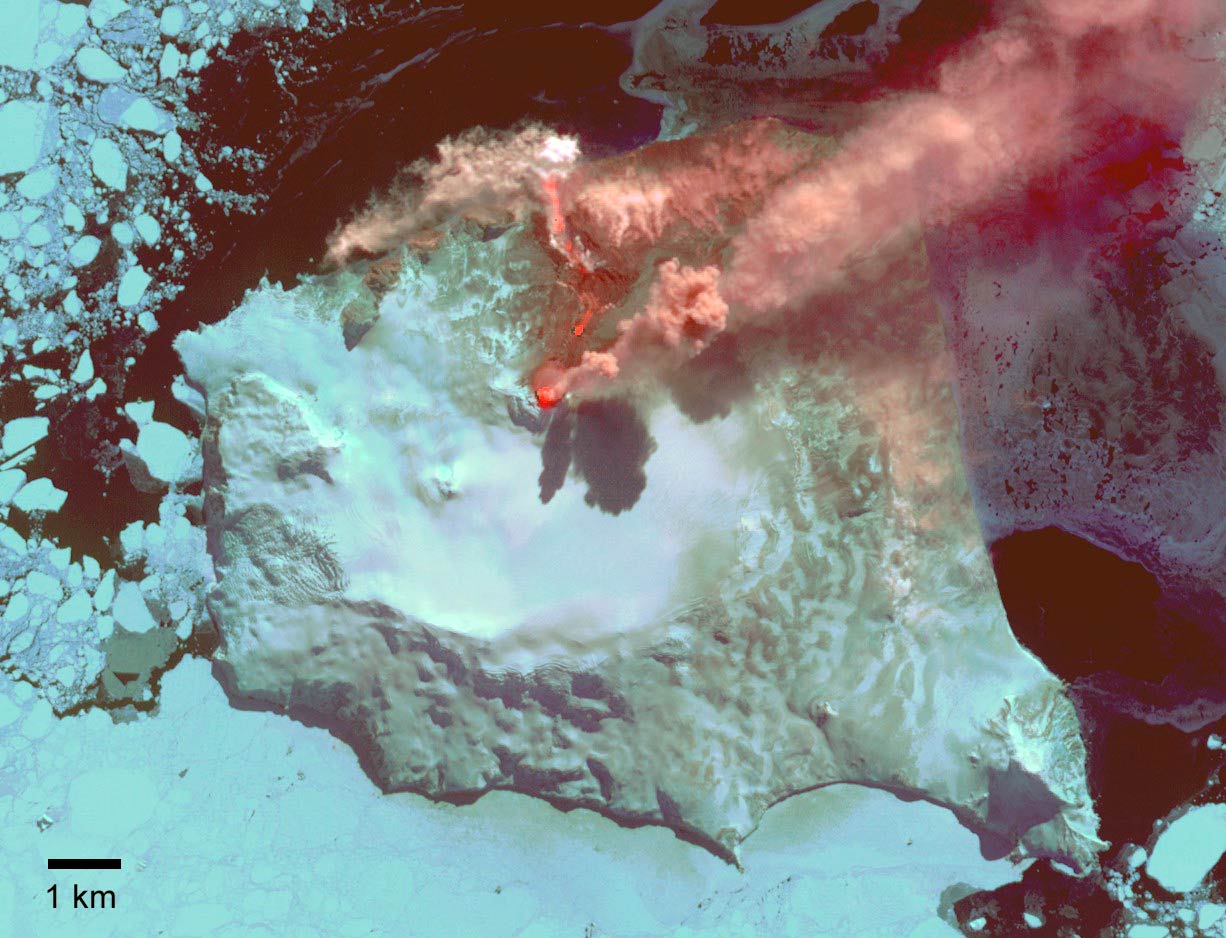
Montegu Is, as seen erupting recently.
Photo: Britsh Antarctic Survey
|
Bellinghausen Id has a K(60) of about 0.6 and Leskov and Bristol Ids 1.0-1.1. Other islands, including Zavodovski and Saunders are mainly basalts-basaltic andesites with no andesitic to dacitic members.
Compared to Deception, although the SSI include much the same range of IAB's to rhyodacites, the Zr is much lower for all three main series with a maximum of 100ppm cf 700ppm. Relative to MgO, Deception has double the Zr and x3 times La. Nb is also less, with a maximum of 2.5 ppm cf ~10. The K(60) is as said, 1.15 cf a range from 0.35 to 1.1 for the SSI. Soda much lower in all SSI. Ti and Fe show the same peak at 4% MgO, but TiO2 has a maximum in the SSI of only <1%, ie, half. Ce/La has close to the same ratio of 2.4 but with Ce all <20 ppm cf 25-75 ppm for Deception, however some dacite-rhyodacites in the SSI were not analysed. La/Sm is similar at 2.2 average but with a suspicion of two trends as seen in Deception.
When fingerprints of the SSI and Deception are superimposed they are seen to be similar in profile though all of the Deception rocks are relatively enriched except that the negative Nb anomaly progressively disappears and the +Ba in SSI becomes -ve.
|
|
Fingerprints for all islands of the South Sandwich group,
IAB's to rhyodacites. |
|
|
Range of K/Silica seen in the South Sandwich Is. |
 |
REE for South Sandwich Is, Scotia Arc. Note the very depleted Candlemas Island, very little different from the most depleted NMORBs. |
 |
Dredged samples from the Scotia Ridge are just as enriched or more so than the South Sandwich Islands. The Deception Id basalts are enriched up to 5 times EMORB but are otherwise similar. |
The lowest trend is that of Candlemas. Note that Deception (data of Baker, Roobol et al, 1975) is, on average higher than any South Sandwich centre.
When time permits we will compare with the IBM arc and the Tonga- Kermadecs in more detail. For now, we will say that such a range of variations in such a high soda, low K series as seen in the Scotia arc are not common.
Back-Arc Basalts
Saunders & Tarney (1979, Geo.Cos.Act. 45, 455-572) present 4 samples from the Scotia Sea floor. These are similar to EMORBS apart from the depleted Nb. They are not Proto Arc are more depleted than EMORB.
 |
Back Arc basalts. |
Cascades Province, N.W. U.S.A:
North of the Trans-Mexican belt, there are no major calc-alkaline volcanoes for more than 1,200 miles except for some minor basalts, ignimbrites and obsidian domes. The first sign of recent volcanism occurs at Lassen Peak east of the Sacramento with its recent dacite flows. To the north-west is 14,000ft Mt Shasta and it's parasitic cone, Shastina. Then comes Crater Lake, Oregon., The Three Sisters, Mt Jefferson, Mt Hood, and north of the Columbia River, Mt St Helens, Mt Adams, Mt Rainier, and, near the Canadian border, Mt Baker. A few basalt flows are found NE of Vancouver at Mt Garibaldi and then another gap occurs until the Aleutian arc is reached in Alaska. The northern extension of the Central Pacific spreading centre is here being underthrust under the continent and this mixture of MORBS and calc-alkaline rocks may explain the mixture of calc-alkaline and continental flood basalts found here.
 |
Variation diagram for the Cascades Arc, Western USA. Note the sweep up of K and decline of Na2O near rhyolites as a lowish K trend turns toward the low temperature minimum in the system Qz - Leu - Ne. |
 |
Variation diagram of oxides against silica for 1552 rocks from the Cascades Province. Wild points are due to inclusion of gabbros and some inclusions and alkaline rocks which may not belong. Nevertheless, the variation is not great. (a GEOROC compilation) |
 |
All samples from the Cascades - MgO vs standard metals. Note the low levels of Co, Ni etc at about half that usually seen in ORB.
Ti, V is also very ow in comparison. |
 |
All Nd - Sr isotope samples from the Cascades. |
 |
Zr vs Alkali Elements for all Cascade analysed samples |
Mt Hood
This massive and rather eroded volcano lies 20 mi east of Portland, Oregon and south of the Columbia River. It is 11,237ft high. The main structure is 500,000 yrs old with 4 minor eruptions in the last 15,000 yrs.
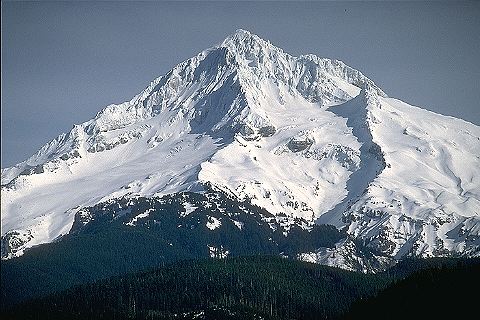
Mt Hood
|
 |
Variation diagram for Mt Hood |
Mt Jefferson
...a massive strato volcano 10,500ft high lying south of Mt Hood, in Oregon. Ric Conrey of WSU has made a very thorough study for his thesis at WSU, involving about 750 XRF analyses plus many ICPMS.
Jefferson, while not as odd as some Cascade volcanoes, has rather low degree of LILE enrichment with a K(60) of 1.0.
The last positively known eruption was about 4500 BC.
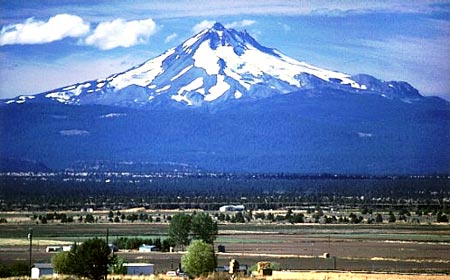
Mt Jefferson. Photo USGS
|
|
|
Mt Jefferson, (fingerprint) |
 |
Variation diagram for Mt Jefferson.
Note the distinctive pattern for all calc-alkaline assemblages, the very high alumina, low FeO, CaO, the high and linear Na with unusually low Ti. Compare with similar diagrams for MORBs, OIB's or CFB's. Yet there are those who claim that Calc-alkaline rocks cannot be distinguished for alkaline series!!! |
 |
Metals for Mt Jefferson. Note the way Sc, V, Zn all decline with decreasing MgO (and increasing silica) along with Fe, Ti, P, completely different to ORBs and OIBs. As it is impossible to conceive of apatite or TiMt being formed at ~ 10% MgO, it is not likely that these or any other calc-alkaline series are fractionated. |
 |
Zr / Alkaline Earths, showing the usual wild dispersion of Ba, Sr. |
Jefferson does however together with it's satellites show a complete range from basalts to rhyolite and is a good example of a calc-alkaline partial melt series. All elements in the basalts show a close relationship with N-Type MORBs being separated from them by about 2% silica. Only iron is higher than the most iron rich MORB primary melts seen on Macquarie, (Kamanetsky, 2000) but iron-enrichment is the most common, often the only, fractionation effect seen in MORBs. When we plot the Jefferson samples together with a few thousand MORB glasses from the Smithsonian data file (Melson & O'Hearn), we see that the Jefferson points trail away from them exactly.
The most common partial melt appears to be an andesite of 57% with rhyolites quite rare. The LILE Cs, Rb, Ba, Th, U, Na/K, Fe/Mg and Si all increase towards rhyolite, the other major elements decrease linearly. Trace elements except for Th, U, Rb, Ba remain about constant and show very poor interelement correlations though Ce/La retains a ratio of 2.15, probably inherited from the parental MORB's. The lack of build up of REE is most surprising compared to tholeiitic and alkaline rocks.
 |
SiO2/ Fe(t) for Jefferson. Note some mafic blocks extend as far as the MORB basalts |
Mt St Helens
This approximately ~10,000ft strato-volcano was given great publicity when it erupted on the 18th of May 1980, killing 60 people and removing 1,317ft from the summit.
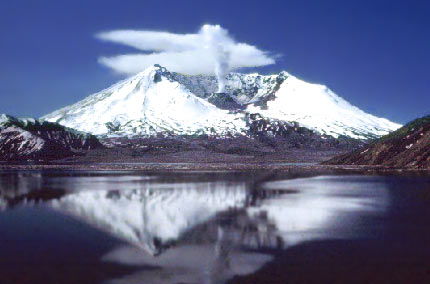
Mt St Helens. Note wee cinder cone within main crater.
Photo: USGS
 |
St Helens (Smith & Leeman, 1993) shows almost no Nb depletion and shows
rather low K as might be expected from it's westerly location. |
 |
Variation diagram for Mt St Helens. |
Mt Shasta
The centre with the most variable compositions is Mt Shasta and its satellite, Shastina (Gunn & Payette unpub., Anderson,1973; Carmichael, 1968; Condie et al, 1973). Our study showed the K60 ranging from 0.5 to 1.75. We did multiple analyses of multiple samples from several flows, parasitic domes such as Black Butte (a dacite), the Lava Park flow from Shastina and flows from Shasta itself. No two lay on the same variation line. We should have done more flows from Shasta including perhaps the major Military Pass flow, but the results of Condies and other's work shows the same results.
|
Mt Shasta, with Shastina beyond. The Military Pass flow lies between them, the Lava Park flow is beyond the right hand ridge of Shastina.
Sandflat lies below snowline, left. Black Butte is on the far side of Shasta.
Photo: USGS
|
 |
 |
MgO/Rb showing variability in units of Mt Shasta.
+ = Shastina Lava Park flow.
x = Black Butte dacite.
* = Signal Butte.
o = Basaltic andesite quarry, poss 2 flows.
Tr = Sandflat flow, Shasta.
Average K(60) for Lava Park, Black Butte = 0.8; Rest K(60) = 1.4.
SiO2 content:
| L.Park andesite |
= 63.5 - 64%; |
| Black Butte hornblende dacite |
= 66%; |
| Sand Flat andesite |
= 61% |
Though there were multiple analyses of up to ten per location, this paper was rejected because referees would not believe the variability. However, later data by other workers, though not of multiple samples, show even wider variation.
It is a pity we did not do more flows, eg multiple sample the Military Pass flow. Shasta and its satellites has even great variability than the Columbia River basalts. |
 |
Shasta and its satellites, XRF data only. |
 |
Normalised multi-element diagram for Shasta basaltic andesites, andesites and dacites (Grove et al, 2001). At first sight they may look quite regular, but look closely. Some of the basaltic andesites have elevated HREE (and Y) and the andesites-dacites also vary greatly. There is almost no correlation between most elements as we have found before. La/Ly, La/Sm, Zr/Nb etc vary widely. |
 |
The REE perhaps show this better, see how the almost horizontal basaltic andesites are split in two in their HREE and the several strands of andesite-dacite completely unlinked by any fractionation. Shasta is undoubtedly, as we thought many years ago, a series of little modified primary melts. We would never put curses on the editor who rejected the paper by Francine Payette and myself, but one hopes that St Peter might read him a little homily, perhaps lift an admonishing finger! One can hope!
Some diagrams such as Ba/Rb give an impression of a backbone of primary melts with some slightly modified members stemming from it, as we see on Macquarie MORBs. But how do we prove it?
Shasta is possibly the most variable centre known.
|
Lassen Peak
Lassen is the southernmost member of the Cascades and was active in 1914-17. There are still fumaroles at Bumpass Hell, in spite of its 3 myr history. The original edifice is called Mt Tehama but 8 dacitic domes have been formed and superposed on it in the last 12,000 yr
 |
Variation diagram for Mt Lassen. Though it is well-known for it's recent dacites, the compositions are well spread. |
Crater Lake and Mt Mazama
Mt Mazama originally formed a great shield -ike edifice but at 7000yr bp the top was blown out leaving a caldera which became the well-known Crater Lake, 1932ft deep. Fifty cubic miles of ejecta was spread over much of the pacific north-west. The crater is about 5 miles in diameter and has one or two younger domes within it now forming islands.
 |
Crater Lake primary magmas, EMORB diagram. |
 |
Mt Mazama Basalt-andesite. - Andesites |
 |
Pre-Mazama andesites enclave |
 |
Pre-Mazama Rhyodacites |
 |
Variation diagram for Mt Mazama, mainly from the work of bacon, (19--) |
Medicine Lake
This is somewhat similar to Crater lake with an underlying edifice mainly of basaltic andesite 150 miles wide and up to 1.5 myr in age. This Pleistocene - Holocene shield lies 50 km to the east of Mt Shasta. There have been 17 eruptions within the last 12,000 yr, some of them, such as Glass Mtn being rhyolite - dacite obsidians
 |
Variation diagram for Medicine Lake.
|
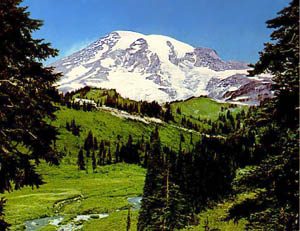
Mt Rainier
| Mt Rainier (14,408 ft) south of Seattle, Cascades Prov.
(I was once arrested for climbing Rainier, but as I was involved in the rescue of a couple of inexperienced people who were lost and could not get down, they let me off!)
Rainier has fumaroles, and may well become active again.
|
 |
 |
Mt Rainier - MgO vs oxides. The wider than usual gap between alumina and CaO-FeOT seems typical of the Cacades. |
 |
Mt Rainier - Zr vs AEE |
 |
Mt Rainier - La vs REE |
Mt Baker
 |
MgO vs oxides variation diagram for Mt Baker. |
Mt Baker (10,775 ft) lies near the Canadian border. A few minor andesite outcrops occur in southern British Columbia, but Mt Baker marks the effective northern limit of the Cascade province.
Basin & Range Volcanics, Western USA
A great many exposures of older (up to 35myr) calk-alkaline volcanics and ignimbrites occur between the Rocky Mountains and the Sierra Nevada. The new database, NAVDAT, is recording all data from this area, and show a progressive younging to the west along with a general decline in K2O content.
The silica and MgO variation diagrams shown below are for the area covered by the States of Nevada and New Mexico. It is by way of a trial as the database is not fully operational, but the diagams show a wide range of mainly calc-alkaline composition, rather as seen in the Central Andes. All samples with more than 2% TiO2 are probably alkaline AOB's, but these are no yet differentiated in the file. The region is dominated by block-faulting and is often given the name of the "Basin and Range" province.
 |
MgO variation diagram for Nevada and New Mexico. |
 |
SiO2 variation diagram. |
HOME
Copyright © 1998-2006 Dr B.M.Gunn
|