THE OCEANIC RIDGE BASALTS
Spreading Centres of the Eastern Pacific
The Oceanic ridge system in the Pacific is taken as beginning at 51 deg N, north of Vancouver Id and lies at first very close to the coast of N America. The northern sector is very much cut and displaced by transform faults. A small plate, the Juan de Fuca plate lies inboard of the Juan de Fuca Rise (named for the Juan de Fuca Strait, south of Vancouver Id.) and is being subducted along its eastern margin under British Columbia. South of the Juan de Fuca Rise is the Gorda Ridge but along western USA whole sectors of spreading centre are being underthrust under the continent. This is part of the basis for the theory that tensional drag from the cold heavy downgoing plate is of more importance than the pressure exerted by the spreading centre.
The sector termed the East Pacific Rise lies about 200km west of the
coast of Peru and is the most interesting region world wide. The EPR
proper is taken as being the zone between major transform faults at
25 deg S and 23N and has the fastest spreading rate known. At 18 - 21deg
S it is given as 16cm / year so we might perhaps expect the chemistry
to reflect this and in fact it does having a high proportion of fractionated
NMORBs with many ferrobasalts and higher fractionates such as icelandites
and ORB dacite-commendite. Any chemical diagrams for the Pacific as
a whole are so heavily influenced by the EPR and Galapagos Ridge that
they have little meaning as regards an "average Pacific basalt!".
Even more interesting is the short, E-W trending Galapagos Rise which lies almost exactly on the equator and forms a triple point with the EPR. It passes north of the Galapagos Islands and into the Gulf of Panama. It has even more extremely fractionated members than the EPR, but these are largely found west of the Galapagos Islands and may be due to the occurrence of the triple point with spreading taking place both east-west and north-south.
The ridge sectors vary somewhat in composition, but even if 30,000 samples have been collected, this is proportionately a tiny sample when it is considered the ridge systems are a total of 45,000 miles long, being less than one sample per mile. As a ridge is at least 20 miles wide, it comes down to an average of one sample per 20 sq miles! Two sets of samples from one area can be dissimilar in many respects, some collections from the EPR and Galapagos Rise for example have failed to find either ferrobasalts or rhyodacite which might be thought to characterize the region. The sectors in the Pacific Ridge system are named as follows:
(1) The Explorer Ridge, 51N
This lies at the northern extremity of the Pacific spreading axis. The basalts are rather enriched and EMORBish but with only K to represent the LILE elements in 263 glasses, and with few TE it is not possible to be precise. Two series are present as can be seen in the separation of the more basic Al, Ca and Fe in the diagram below.
 |
Variation diagram for the Explorer ridge segment, near the northern end of Victoria Island, a mixture of glasses and WRs. Those of > 10.2% MgO are cumulates. Note the presence of a few ferro-basalts with 17% FeOT, which are advanced fractionates.
A few low-degree melt EMORBs from seamounts have very high K2O (2.25%) and low Fe. These rocks include one of the very few rocks of this type to be analysed for at least some TE. It has extremely high Nb, 73 ppm cf <10 for higher degree melts. with a Zr/Nb of about 5.5 cf with 20 - 100 for most of the rest. La/Sm is 6.5 cf 2-3. |
 |
MgO vs K2O for Explorer Ridge.
Any samples to the right of the primary magma boundary (defined by Macquarie Id primary melts) are cumulates. Note the tholeiitic high K EMORBs from seamounts. |
 |
Zr vs Zr, Nb, Y, Rb, Sr, Ba (Alkaline earth elements) |
 |
The Zr/Nb diagram shows a wide range, the dashed line showing the boundary between tholeiitic and AOB's in the OIB series. The standard EMORB passes slightly higher, passing through 8.3 ppm Nb at 73 ppm Zr. The upper, Nb enriched samples are therefore all EMORBs agreeing with the REE data. |
(2) The Juan de Fuca Ridge
 |
REE diagrams for the Juan de Fuca Ridge. The dispersion of the light REE shows the wide range of partial melts present. The data of Stakes and Franklin, (1988, Proc.ODP.Sci.Res.139) shows a range from NMORB to moderate EMORB but is not included. The data of Van Waggoner et al, (1991, J.Geophys.Res.96) are mainly fractionates on NMORBs while data of Cousins et al, (1995. C.Min.Pet.120) include EMORBS of up to x3 EMORB standard. These latter data do not include Dy, Ho, Er, Tm and all have had Pm and Pr interpolated. |
 |
Variation diagram for > 1100 samples from Juan de Fuca. Samples of more than 10.2% MgO are cumulates. Some dolerites of erratic composition have been removed but some wild points remain. We may later try a diagram for glasses only. Rhyolites in the 2001 dataset seem to have now been removed from PETDB files, and are possibly now included in the Explorer Ridge set. |
 |
K2O vs MgO for Juan de Fuca. Minimal fractionation is seen, but some enriched lower degree melts are included. |
 |
Variation diagram for Juan de Fuca; glasses only. |
The Juan de Fuca Ridge lies west of Vancouver Id, at about 40-48N and 129-130 W. and the principle data consists of 803 analysed glasses from the PETDB files. These form the usual ovoid group of data points, as shown above, similar to Gorda Ridge, with 5-10% MgO, 2-3.3% Na2O and 0.05 - 0.35% P2O5. There are no EMORBs in this data set, however about 40 are included in the Smithsonian Deep Sea file from seamounts not far north.
Data by Cousins et al 1995, (C.Min.Pet. 120, 137-357); by Stakes and Franklin 1998, (Pr.ODP Sci. Res. 139), and Van Wagoner et al, 1991,( J.Geophys.Res. 96, 16295-318), show fractionated rocks running from depleted NMORB to about an EMORB level of enrichment. However, no EMORBs are present in the PETDB glasses. Some samples of more enriched origin have been fractionated to 25 ppm Nb and 180 ppm Zr, 12% FeOT levels, but precision is not good even in Ce/La. There is no evidence of magma mixing etc as some of the writers claim. Small Fe/Mg fractionation effects and many small differences in degree of melt explain all variations.
(3) The Gorda Ridge
 |
Variation diagram for Gorda Ridge, glasses only. Quite depleted NMORBs with a La/Sm as low as 1 and Nd = Ce for some, but insufficient data to be precise. |
This segment of the Pacific Rise lies north-west of Northern California in Lat 40-41N and 127.5W. There are available from the PETDB database 76 major element data sets done by EMP on glasses and some scattered trace element data. This series of N-MORBs stems from a rather more enriched parental series than, say the Kolbeinsey Ridge but similar to Juan de Fuca, with an average soda of 2.7% approx, cf, 1.75% for Kolbeinsey. The series are somewhat fractionated toward FeTi basalt with 5-9% MgO and 6.9 - 9.5% FeO. TiO2 is from 1 - 2%, K2O from 0.05 - 0.3%.
A good trend of Th/U gives a ratio of 3.01 with a Ce/La of 2.8. There seems to be no Nb data for the Gorda Ridge. Zr/Hf gives a very inconstant ratio and the data appears to be defective, the Zr being low.
 |
Variation diagram for 1174 basalts glasses from the combined Juan de Fuca, Explorer and Gorda Ridges. Apart from the inclusion of rather more EMORBs in the northern Explorer Ridge, they are similar. The 7 samples of only 8% CaO at ~7.5% Mgo are all dredged samples from JDF analysed by EMP and no explanation for their difference is apparent, other than possible analytical error. |
 |
TiO2 and P2O5 vs MgO. The wide range of TiO2 especially is similar to that seen in all Continental Flood Basalts as well as in any ORBs where a range of degree of melt is present.. |
 |
SiO2/K2O. A typical NMORB - EMORB and included Mg-FeTi fractionated series with no enrichment beyond the TiMt point. |
(4) The Gulf of California
The Gulf has been formed by the spreading centre passing into the continent and separating the continental landmasse as is alo seen in the Red Sea, Baja California being separated from northern Mexico..
 |
Variation diagram for the Gulf Spreading Centre.
As may be seen, almost entirely unfractionated basalts.
The data are rather old and the available trace elements are of poor quality. |
(5) The Siqueiros Transform Fault Zone
The Siqueiros Zone consists of a sector
of the EPR at about 8 deg 23 N which is offset to the west by about
ten miles. The Mendocino FZ to the north brings the EPR more or less
back into alignment. Along the SZ occur a series of young, extremely
depleted volcanic centres associated with olivine basalts, and picrites
to 18% MgO. Perfit etal, (1996, EPSL 141, 91-103) found the picrites
to have fairly uniform olivine at Fo90. Only a small number of glasses
were analysed but MgO is < 10.2%, the Nd exceeds Ce and La/Sm is
as low as 0.5 but remains constant in the picrites. However the olivine
appears to have separated before being joined by plagioclase as Sr exceeds
Zr in the picrites, Ba is < 10 ppm and Rb and Nb vanishingly little.
Apart from the relatively lower Ba, Rb, we see again a chondrite pattern
for the Zr group elements.
These lavas appear to represent the extreme depleted margin for the
ORB compsoitional envelope. Mike Perfit has promised more data!!!
 |
Variation diagram for Siqueiros picrites and glasses. Note low TiO2 relative to soda. |
 |
Zr vs Sr, Ba, Y, Ba, Rb for
the Siqueiros TFZ lavas |
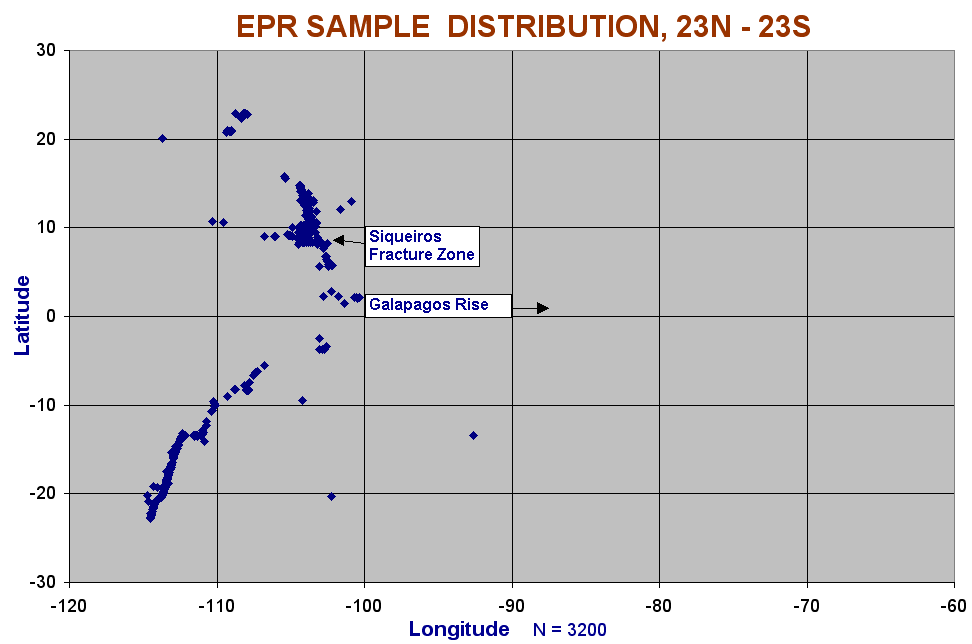
(6) The East Pacific Rise
The East Pacific Rise is taken as the sector from a latitude of 23S to 23 deg N.
The first icelandite - rhyodacites found in the oceanic ridge environment
were included in Melson and O'Hearns Deep Sea glass file of more than
20 years ago and came from 0 - 2deg N on the EPR. They were then the
most K-group and Na depleted rhyodacites known, but now some from the
Galapagos Rise are now known to be similar. , Kolbeinsey Ridge and Reykjanes
Ridge ( N and S of Iceland) includes equally depleted DMORBs but do
not include higher fractionates. Most Ridge "rhyolites" have
< 10% qz and so should be termed "commendite".
 |
Latitude-Longitude dispersion of the ~ 3200 glass samples collected from the EPR. The Galapagos Triple Point occurs near 0 deg Lat and the Galapagos Ridge extends east parallel to the equator. |
 |
Variation diagram for the EPR.
These basalts are mainly depleted, high degree partial melts but
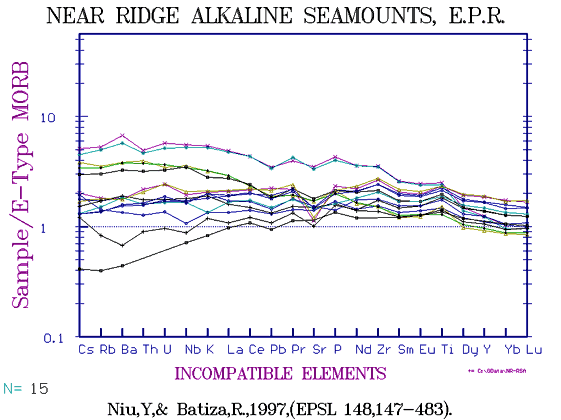
the discovery by Niu and Batiza (1997) of off-ridge seamounts of
EMORB type means that a wider range of compositions can be found.
Note how the Fe and Ti peaks change from 3 - 6% MgO as we go from
NMORB to extreme EMORB. |
 |
Variation diagram from another restricted area of the EPR - GR region, between 0 and 4 deg N. The majority are from 0 to 1 deg N and from -83 to -86 Long. in the Galapagos Rise, so in spite of the apparent limited range of fractionated DMORB, the samples are not closely related. At least three minor variants can be seen in the Fe and Ti peaks. Almost all have Nd = Ce, La/Sm ~ = 1. |
 |
REE normalised to EMORB for the 0 - 4 deg N NMORBs,
which are highly fractionated by Ol + Plag removal. Note increasing
Eu anomaly. |
The 0 - 4 deg N samples extending from
the EPR along the GR show one of the best ranges of fractionated
NMORB but many of the samples date from Melson and O'Hearns work
which was for ME only. The TE which have been done are at best patchy,
but do show the characteristics of depleted N MORBS well.
Note that in this series the Zr extends from 50 - 700 ppm in the
basalt to ORB-rhyolites, compared to only 30 - 110 ppm seen in the
similar but much less fractionated Kolbeinsey Ridge basalt-ferrobasalt
of the North Atlantic. The difference in REE is less, 0 - 26 ppm
La cf 0 - 9. |
 |
The REE of the EPR (N = 88), normalised to EMORB. Note
that the upper members are parallel, ie are fractionates of NMORBs,
while lower members are less fractionated. Few EMORB appear to be
present |
 |
La/REE for 0 - 4N NMORBs against La. Note that for
all samples Nd = Ce and La/Sm = 1, ie no EMORB are included. |
 |
La/REE for all EPR. Not wide spread of composition
when seamount EMORBs are included. |

|
Zr and alkaline earth elements for 0 - 4 deg N. Fractionated
NMORB only.. Sr is remarkably low at < 100 ppm and remains constant
right through to ORB-rhyolite because of early formation of plagioclase
which must take in about 140 ppm. Unfortunately few samples were
done for both Ba and Zr, but some Ba are as low as 5 ppm, average
63. |
 |
Zr and associated elements for all EPR. NOte flate
trend of fractionated Sr in plagioclase especially |
 |
The EPR at 12 - 14 N, ie a little north of the region
sampled by Regelous etal,*(1999) and Niu & Batiza (1997), (see
below) but see limited range, no ferro basalts, and only a single
rhyodacite. Plots of silica against latitude show that high silica
rocks are mainly limited to close to 10 deg N. |
 |
A combined variation diagram of the EPR plus the adjacent Galapagos Rise, combining both glasses and fresh whole rocks. This shows rather graphically (pun intended) the marked diffences between this area and the rest of the world's spreading ridges. Most are depleted large degree melts to only moderately enriched rocks, there are no extremely enriched low degree melts present. Most of the higher fractionates, including rhyolites (to left) are from the Galapagos Rise. Lack of low Ti, Fe (and V) rocks at the TiMt point at 5.75% MgO show that extreme EMORBs are absent, as does the general low K.
The few erratically high FeOT are almost certainly in error being
probable double entries of FeOT and Fe2O3T, but this cannot be
proved at this moment. The addition of whole rock data means a
few show sign of alteration and a few cumulates are also present.
(nb: June, 2005. PETDB now appear to have corrected the Fe errors)
|
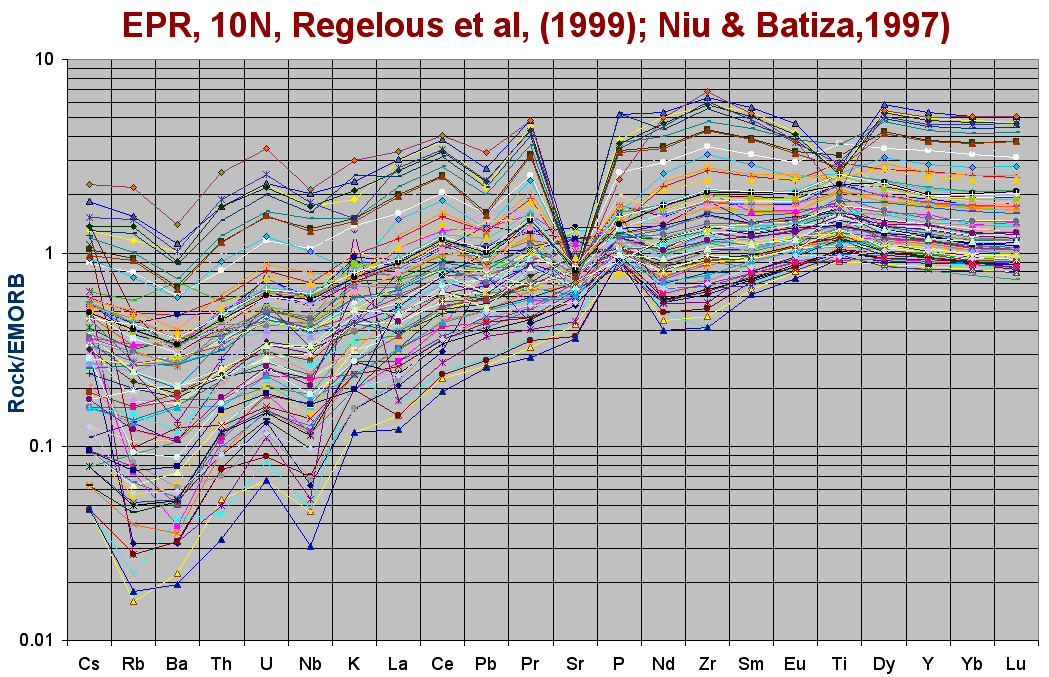
One of the best and most interesting sets of data was published by Regelous, Niu, Wendt, Greig & Collerson (1999, E.P.S.L. 168) for a cross section of the EPR at 10 deg 30 N. It happened to include a complete range from magnesian basalt to rhyodacite, all related by fractional crystallisation, and for the first time gave a clear indication of fractionation trends in depleted MORB rocks. It was not perfect as a suspicion of two lineages can be seen in some diagrams, eg MgO/FeO(t), but was by far the best to that date and for that matter is still one of the best now, (June/04).
 |
Fractionation trends of the EPR at 10 deg 30N. MgO vs Oxides. (Regelous etal, 1999) Note the spread in ferrobasalt compositions suggesting more than one lineage. Repeating a search down to 1 minute intervals of latitude does not exclude different members so two centres must overlap. |
|
|
EMORB-normalised multi-element diagram for the EPR
at 10 deg. 30 N..
The strong parallelism of the compositions of the samples related by fracational crystallisation is well shown. It is obvious that many element pairs, eg Rb, Ba or U,Th, La,Ce or Zr/Nb have a strong correlation. (data from Regelous et al, 1999; diagram constructed 1999) |
|
|
EMORB-normalised diagram for a different region of the EPR including seamount EMORBS. Note developing Eu anomaly with ol+cpx+plag fractionation, and the constancy of Sr due to take up in the plagioclase presumably.
Click here to see the REE plotted in the REE chapter. |
|
|
This diagram probably includes more geochemical information than any other ever published! It is formed by combining the data of Regelous et al (1999) with other nearby data of Niu & Batiza (1997) from which 20 high Nb, slightly alkaline EMORB samples (seen below) have been removed. The ones included are mainly more depleted higher Mg NMORBs. Careful inspection shows which element pairs have a close correlation and which show progressive change. Those at the bottom are probably increasingly depleted partial melts, those at the top are the products of crystal fractionation.
Note the lack of any sharp break between. The P behaviour is very odd, remaining high but at constant level through much of the series, then increasing sharply at the top. The low Nb imitates the fingerprint of IAB's.
The lower diagram dates from 1999, the upper one from 2004. |
|
|
Fingerprint of the, high Nb seamounts adjacent to the
EPR. (Niu & Batiza, 1997) Some are partial melt variations,
some are partly fractionated. |
 |
REE/La for EPR ORB glasses around 10ºN - La vs
REE. The more fractionated series of Regelous etal (1999) have Nd
< Ce. |
|
|
Ce/La combined data for 0-18N, the peripheral seamounts, for Site 504 and for 16-18N. Note the almost perfect relationship, but that also it does not QUITE pass through the origin so ratio is not constant, note also slight curve. However, this defines the EPR high degree melt Ce/La quite well. |
|
|
Th/U for the EPR. This very precise ratio differs slightly from other sectors of ridge where lower degrees of mantle melt are found. It is only in the last 4-5 years analytical precision has reached these levels for these elements. |
|
|
Li/Lu for EPR. There is not much data as good as this for Li world-wide. On the relative partition coefficient scale Li seems to belong with the HFSE being closest to Lu. |
 |
La vs Sm for the EPR. This ratio is close to 1 for extreme NMORBs |
 |
MgO vs Y for the EPR. Note how in the more magnesian rocks the trend, governed by a cp + plag + ol + hy cumulate of about 9% MgO, curves towards an ol (or ol + hy) + plag cumulate of higher MgO. Possibly in the most magnesian NMORBs the cumulate is at first pure ol. |
|
|
Ca/Mg diagram for 571 East Pacific Rise basalt glasses from 12deg - 20 N, (Thompson,G. et al,1989, Geol.Soc. Sp. Pub. 42, 181-200) together with 167 basalt glasses from the Smithsonian Deep Sea Glass file, (Melson,W. & T.O'Hearn.).
Note in this case lack of picrites and trend towards icelandite, and oceanic rhyodacite. |
|
|
Note the wide range in Ti (and also alks) in the EPR, a few samples are more alkaline trending towards EMORBS. |
|
|
Na-Mg-K diagram with two distinct trends of fractionation, the low K being from Melson & O'Hearn, Lat 1 - 1.5 N, the other from Regelous et al,(1999) from 10deg 20N. |
|
|
FeOT-MgO-Alk ternary diagram for 21 files of EPR glasses. At least four separate fractionation trends are shown, the lower one being the EMORB seamounts, the others show the variabilty of the TiMt IN point with variation in degree of melt, also the correspondingly variable alkali content. |
|
|
Relative alkaline earth elements for a fractionated high degree melt NMORB series.
The abundances are Zr > Y > Ba > Nb > Rb unlike low-degree enriched melts where Ba and Rb greatly exceed Y. |
 |
Garrett transform NMORB around 13ºN by Niu and Hekinian (1999), also by Wendt etal(1999). Some of the dredged samples are harzburgites. At this point it is not certain whether these are massive cumulates or included blocks. |
(7) The Galapagos Rise
This, as stated above, is a short spreading centre lying on the equator and north of the Galapagos Islands and which projects from a triple point junction with the EPR towards the coast of Ecuador. It has been heavily sampled, for, like the nearby EPR between 0 and 10N, it includes many fractionated groups with ferro-basalts to rhyolites, and a wide range of compositions from very high-degree melt depleted NMORBs to enriched EMORBs, the latter mainly occurring, it appears, in somewhat off-ridge seamounts.
 |
Variation diagram for the Galapagos Rise. (PETDB and Smithsonian glass files)
This is the most important diagram of all and without understanding
it, no grasp of the rationale of oceanic basalt compositions can
be had. That which follows expands on what is said in the "Overview
and Comparisons" for Oceanic Ridge Basalts.
As can be see (especially in the iron trends) at least three fractionated series are present peaking at different levels of iron in the ferro-basalts (16 - 19% FeOT), with parallel differences in TiO2. A cluster of unfractionated or very slightly fractionated EMORBs are seen at 6.5 to 6.8% MgO. Unfortunately there are no trace data for this group and not many for the Galapagos Rise as a whole, there being only a dozen of Zr/Nb for example and these are all high, in the range 30-50.
The black lines between 6 and 10.2% MgO represent the range of
unfractionated possible parental MORB basaltic melts. Those at
the high MgO end are high degree partial melts and are very depleted
in LILE (Cs, Rb, Ba, U, Th, Nb, K, LREE etc). Those towards the
left (6% MgO) end, are much more enriched, having at least ten
times the LILE content. Parental tholeiitic magmas of < 6%
MgO may exist, though not recognised yet. None are known, even
in Kolbeinsey or Reykjanes Ridges of more than 10.5% MgO.
The lines are a close approximation of the least fractionated
partial melt series from Macquarie Id, (Kamenetsky et al, 2000).
The flat base of the iron distribution makes an almost perfect
fit. A few high alumina samples are something of a puzzle as no
glasses should lie on the "forbidden" side of the melt
plane, but as plagioclase is the first mineral to appear along
with olivine in high degree melts, there may be some resorption
effect. CaO does not fit perfectly, the flat termination suggests
a parental melt line as shown. For this element, the Macquarie
samples show some scatter and minor fractionation effects but
appears to incline more to the left. Soda and K (not shown) are
well defined.
It seems that MORB basalts can originate at any point along these
lines and can fractionate at high angles in the directions shown
by the trends of this diagram. The wide range of compositions
seen in MORB rocks are thus explained. Of about 10,000 analysed
glasses, only very rare points lie outside of the polygons defined
by the parental melt trend and the fractionation trends.
It is not possible to produce a similar diagram for OIB's or even transitional rocks as there has been no program of analysing only glasses for these and crystal cumulates lie on the other side of the parental melt planes. It is suspected that the partial melt plane shifts in more alkaline rocks towards high MgO and higher LILE content, so the variation diagram shown can be considered as one extreme of a three dimensional set of planes.
Rhyolites have 70% silica, 4.5% Na2O and 1.6% K2O but no TE are
available, nor do we have TE for the extreme EMORB near 6.5% MgO.
|
 |
Variation diagram for new study of W. Galapagos Rise by D. Christie, (2004, submitted file)
Scattered fractionated groups, ranging from very depleted NMORB,
La/Sm<1 to moderate fractionated EMORB, La/Sm = 3, no Nb or Rb
data. Some Ba data for the more depleted members shows Ba < Y
at the sub 10 ppm level, but no data for more enriched members. |
 |
K/MgO diagram showing relation to the parental melt
limit. Note the apparent continuity but really made up of discontinuous
clumps of data derived from different parental melts. The highest
K samples are EMORB. |
 |
Zr diagram for Galapagos Rise. Note very low level of fractionated Sr in plag. Such a pattern for depleted DNMORb contrasts strongly with the fractionated EMORB in which Sr and Ba greatly exceed Zr, and Ba may reach 350 ppm even in basalts. Zr in a highly depleted series is seen to reach 700 ppm. |
 |
La vs Sm. A few EMORBs present but some data is old and possibly not of best accuracy. |
 |
La vs REE showing wide spread in composition of different parents in the GR. |
| |
Comparison of the Galapagos-EPR region with Hawaii as represented by Mauna Kea. (Zr vs
Nb) |
| |
Mg/Si for Galapagos Rise compared to Galapagos Is, (GEOROC). The Rise samples are consistently 2% higher in silica. |
Alkalis vs MgO in Ridge and Islands.
Here the islands are consistently alkali enriched, (mainly Na) compared
with the submarine samples. The islands are the more "alkaline"
but are still in some cases more depleted in the LILE elements than
E-MORB. (see section on Oceanic Volcanic Islands). Obviously the
old term "alkaline" does not always infer LILE enrichment. |
(8) The Chilean Ridge
Here we have another triple point between the EPR and the Chilean Ridge which separates the Nasca Plate from the Antarctic Plate.
With a spreading rate of only 2cm per year, we have a small range of composition. However, Bach et al (1996, EPSL 142), show a group of samples with extremely depleted LILE and especially Nb.
 |
Var. Diagram for Chilean ridge, 1998.
These have the same Zr/Y as the EPR (3.5), the same La/Sm (1.16) but lower Nb, Rb/Zr, and Th/Zr the Zr/Nb being 86 cf 28 for fractionated EPR at 10 - 12 N. No major elements are included with the TE data set unfortunately. |
 |
Variation diagram for the Chilean Ridge, 2003.
With only 260 ME samples for this ridge which interesects the EPR more than 1200mi from the Chilean coast any comments must be limited especially as only a handful of TE are available (<90).
In spite of the slow spreading rate, fractionated NMORBs dominate, being quite similar to those of the Galapagos Rise with a Zr/Nb of 25 - 40. A small number of moderate EMORBs are present with a Zr-Nb of 6-8 and distinguished in the diagram by their low Fe,Ti and higher Na. Both series terminate in rhyolites so the K content of these is rather variable. Because of the low number of samples both glasses and whole rocks have been included.
|
(9) The Pacific-Antarctic Ridge
The southern section of the Pacific Rise south and west of the Challenger Fracture Zone which itself lies about 200ml south of Easter Island, is called the "Pacific-Antarctic Ridge".
It extends almost 4000 miles to the transverse Macquarie Rise, SW of New Zealand.
HISTORIC NOTE
This is a section of ridge I have some interest in, as I was the first to see it. Well, perhaps not exactly to SEE it but see it on a Fathometer trace. In Nov. 1955 we were rolling our way south to McMurdo Sound on the good ship USS Edisto. The chief oceanographer on board was I recall, Dr Bob Littlewood of Wood's Hole who was endlessly patient in showing me how his bathythermographs worked. We had crossed the Campbell Plateau and the bottom had descended to the immense plain of the South Pacific Basin. I was filling in time on the bridge yarning the OD who was a 19-year-old Lt. jg, with one eye on the fathometer trace, when is suddenly began to erratically rise, very unexpectedly.
"Hello", says I, "We must have a Seamount!" It came up and up from about 2500fm to only a few hundred. I scribbled on the chart, working out it had risen about 12,000ft in less than 20 miles, about the same grade as the western side of the Southern Alps. At one point the OD dashed out to the wing of the bridge with the glasses looking for possible islands. Then the trace began to go down again.
I was by this time pretty stirred up, if it was a 12,000ft mountain, where was the high point? It would have been an impossible coincidence if we had come over the summit, and I demanded "Turn this damn ship round!" Now this shows the enormous advantage of going to sea on an American ship; had she been Royal Navy, I would have been booted off the bridge, in fact not allowed there in the first place! The RN for the last two or three hundred years have looked on civilians as a kind of sub-species of humanity, Americans actually treated me like a human being, a fact I was not unappreciative of. (I even got called "Sir" by the crew!) The OD went off to see the captain who then sent for me. "Hello son! I hear you are all excited about a big seamount. What do you want us to do?"
I suggested a square search pattern to see if it was a ridge or peak and what its shallowest depth might be.
"OK!" says the skipper. "I'll call a conference with my officers and if we can, we'll do it." Ten minutes later the verdict came out. "Sorry, we can't at this time, we have to be at the pack-ice edge tomorrow to meet cargo ships. But I'll tell you what we'll do. I'll radio CINPAC Hawaii and ask him to order the ships coming a day behind to separate and steam parallel courses. That should tell us what shape it is!"
As any chart of the South Pacific will show, (they show the routes of ships making fathometer traces) they did just that, and it proved to be a ridge. Though the Mid-Atlantic Ridge was known to exist, fifty years ago, it was not suspected that ridges might also occur in the Pacific. We came back over it three months later, this time on the USS Icebreaker "Glacier". Captain Maher was a seaman and a gentleman and I used to play bridge with him. By that time many things had happened and although I went up on the bridge to 'see' it again it did not occur to me to ask Capt. Maher to do that square search pattern which I am sure he would have, and could have been interesting. I am also sure that with the aid of a belaying pin I could have controlled the crew who were anxious to get back to civilisation, (if that is not praising Christchurch too highly!)
I always referred to our ridge as the "Indo-Pacific Rise" but the name seems to not have caught on. Vlastelic (1998) records samples taken from a few hundred miles to the NE from only 165m depth, possibly an alkaline seamount perched on the ridge itself. We later found and climbed several mountain ranges of up to 12,000ft in the Antarctic, but this time not under water. Sadly, no one will ever find a whole mountain range either below or above sea level again, at least not on this planet; fortunate was I not?
Data for Pacific-Antarctic Ridge
PETDB and published sources yield a mixed bag for this area. 174 samples, mostly glasses, have been recovered by a dozen expeditions, but none have been done for any kind of complete range of elements. Eg, only 14 have been done for Rb, 10 for Ba, 15 for Sr, 75 for Nb-Zr. About a third have not been done for P.
This is very unfortunate as some ferro-basalt to dacite is included, quite similar to the EPR. The bulk are depleted N-MORBS, some more like E-type and a few are alkali basalt-hawaiite mugearite. A dozen samples show a very good Nb/Ta ratio of 14.8, but appear to only include the alkali-basalt-mugearite group.
Sr, Nd and Pb isotopes all show a very high noise level, the Sr87/86 especially increasing steeply in the alkaline rocks (0.7024 to 0.7046) with Nd isotopes showing a negative correlation.
Zr/Nb seems to range from 25 in the dacitic rocks to 10 in the more alkaline, but with only 3-4 samples each, this is not positive.
The ferrobasalts-dacites seem to occur only at about 40S, south of the Challenger Fracture Zone, (Hekinian et al, 1999, Marine Geol. 160) but most of the Pacific-Antarctic Ridge is still unsampled.
Vlastelic (1998, 1999, 2000) has sampled the western section also ranging from depleted N-type MORB to alkali basalt-hawaiite. Some from near the Eltanin Fracture Zone show a remarkably elevated Ti and low Y. It is so unusual as to make the data suspect.
 |
Pacific Antarctic Ridge. MgO vs oxides. PetDB. |
| |__| |
Central Pac-Ant Ridge, (Vlastelic, 1998) |
| |__| |
Pac-Ant. Ridge and Foundation Seamounts from south of Challenger Fracture Zone. (Hekinian, 1999, Marine Geol. 160). |
(10) Indian-Antarctic Ridge
This extends from the now defunct Macquarie Ridge which lies transversely, west to the islands of Amsterdam-St Paul and lying about midway between Australia and Antarctica. Again the available data seems to be minimal. Klein, Langmuir and Staudigel, (1991) show a series of N-type MORBs of between 7 & 10% MgO. Nb is not included and La/Sm or even Ce/La shows considerable scatter.
Pyle et al, (1994, PhD, OSU) shows a range of basalt-ferrobasalt of 9-15% FeT with one sample falling beyond the TiMt IN point. Again Nb is not included. Zr/Y is quite regular at 3.7, La/Sm =1 and Zr/Hf =39.
 |
Variation diagram of early data available ten years ago, by Pyle et al (1994) |
 |
All available data at year 2002. |
 |
New variation diagram of glasses from Indian-Ant. Ridge from 89-117E. These EMP data by Christie et al, (2004) are of superior quality. A wide range of primary magmas of La/Sm 1 - 3 and Zr/Nb of 9 to 50 are seen.
The almost horizontal sub-parallelism of the soda fractionation trends shows that the cumulates were either Ol + plag or Ol + Cpx + plag |
 |
Mg/K diagram showing enriched K2O in the many EMORBs present. Silica is rather variable from 49 to 53%. K2O/MgO shows the wide range of degree of partial melt present |
 |
The REE for the South-West Indian Ocean Ridge. |
 |
Zr / Sr, Zr, Y, Ba, Nb, Rb. Note some EMORBs have Ba > Y. |
(11) Macquarie Ridge
Macquarie Island (Kamenetsky, et al, 2000, J.Pet) is an uplifted remnant of the now defunct Macquarie spreading axis. It its dying stages this ridge segment extruded a range of virtually unfractionated lavas ranging from moderately depleted NMORBs to some very low degree partial melts of alkaline character, the classic EMORB sequence. These are described at the beginning of this chapter, and also under Oceanic Islands of the Indian Ocean so will not be gone into here.
(12) The Ross Sea
The Ross Sea lies on the down-thrown side of an immense fault block system that extends across the whole continent. In the middle of it lies the steep pinnacle of Scott Id. In 1956 I requested permission to land and sample same. Being on an RN ship this time I was told to get to hell off the bridge. However, Dr Ian Smith of Auckland later did and it proved to be a phonolite of the McMurdo Volcanics. (Smith pers.comm.). Some bottom samples have been recovered by the Eltanin (Campsie,J. et al,1983, N.Z.J.G.G 26,31-45) and these are alkali basalts, trachytes and phonolites also of the McMurdo Group. One might assume these lie on a granitic complex basement, though drilling at Cape Roberts shows the floor of the McMurdo Sound to consist of thousands of feet of sub-glacial breccias which have been penetrated through to down-faulted Beacon Sandstone which, on the upthrown side of the fault, rests on a peneplained surface of Devonian age cut in a gneiss-schist-granite complex. Small alkali-basalt seamounts of the McMurdo Group may be dotted about the Ross Sea. The main McMurdo Group form a series of massive alkali-basalt to basanite-phonolite active and extinct volcanoes up to 13,000ft in height, described under "Continental OIBs"
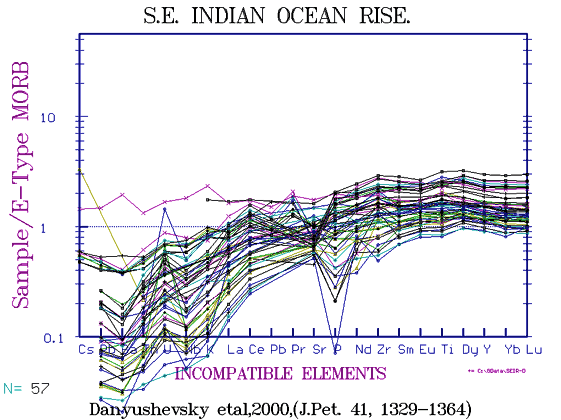
(13) South-East Indian Ocean Ridge
This ridge shows a wider variety of composition than usual, (Danyushevsky et al, 2000, J.Pet 41) at first sight similar to the EPR (Regelous et al, 1999). In detail there are three main series, one more depleted than the EPR but similar to other parts of the EPR eg at 18-19N. (Niu et al, 1996) with a Zr/Nb of 70. A few samples are the same as the main EPR, the rest more alkaline, almost E-type. There are no ferrobasalts.
|
|
Fingerprint for the South-East Indian Ocean Ridge |
|
|
As for the SWIOR, the South-Eastern Indian Ridge also has a wide spread of composition. Unfortunately only 44 samples have been analysed for Nb and data are scattered. Zr-Nb shows two main trends at Zr/NB of 60 and ~5.7 but were data for the other 307 samples available, the picture might be quite different. La-Sm ranges from 1-3. As the major element variation diagram shows the main fractionation trend is intermediate with a slightly steeper Fe-Ti than seen in the SWIOR, with a ferro-basalt maximum of 14.6 % and about 3% TiO2. Again, note the wide range in TiO2 (and FeOT) levels at any constant MgO. |
 |
Variation diagram of the SE Indian Ocean Rise from 77E to 137E Long. This extends south and east of Cape Leeuin, the new data of D. Christie, (2004, deposited file) includes Long. 91-113.7E sometimes called the Indian-Antarctic Ridge.
All FeTi basalts of a wide range of partial melt, which can be seen by the broad base for FeOT where the plane of partial melt extends from about 10% MgO, 8% FeOT to 6% MgO, 6% FeOT. Whole rocks are included so some cumulates are present. |
 |
K2O - TiO2 diagram showing the effect of a broad spread of partial melting but moderate fractionation. |
 |
MgO / K2O. The spread vertically is due to difference in degree of partial melt. One or two cumulates cross the partial melt parental plane. La/Sm ranges from <1 to > 3 |
The Ce/La is similar to that of the EPR but the La/Sm is again split in three, one trend being similar, one more depleted and one more enriched.
(14) South-West Indian Ocean Ridge
 |
Variation diagram for the SW Indian Ocean Rise.
The rocks vary widely from very depleted with a Zr/Nb of ~60 to very enriched Zr/Nb ~3. The most fractionated group are intermediate, Zr/Nb 6, La/Sm ~3-4. This is made apparent by the flatter slope of the FeOT in the diagram which peaks at only 14% iron in the ferro-basalts. The scattered high Al2O3 are mainly EMORBs but some may be slightly altered as whole rocks are included. |
 |
K/MgO for SWIOR. A wide range of partial melt fractionates is present, but though WR's are included few cross to the forbidden side of the plane of partial melts as defined by the Macquarie series. |
|
Metals for the SWIOR. The constancy of Co in a mixed range of paerents would suggest that its plane of partial melts must be very close to the fractionation direction, as it in fact is. |
(15) Central Indian Ocean Ridge
 |
The Central Indian Ocean Rise extends north from the triple point with the SWIOR and the SEIOR. There are only 250 ME analyses and a handful of trace elements so no definitive remarks can be made. A general absence of magnesian members and a good many medium EMORBs are present. Most of the REE done do not include La. |
(16) The Red Sea Spreading Centre
Where the Carlsberg Ridge meets the Red Sea, there occurs another triple point as a very slow spreading ridge passes up the Red Sea while the Afar - E. African Rift zone departs to the south.
 |
The Red Sea.
A large number of cumulates appear in the non-glassy rocks, and a wide range of Na is seen (up to 6%) and K, (up to 3%). Some rocks have as low as 45% silica but these are all cumulates. Non cumulative rocks centre on 51% silica, ie they are EMORB low degree partial melts as would be expected. However, note a few depleted members as well. |
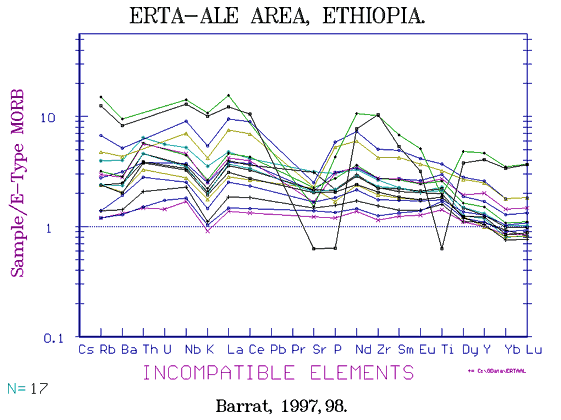
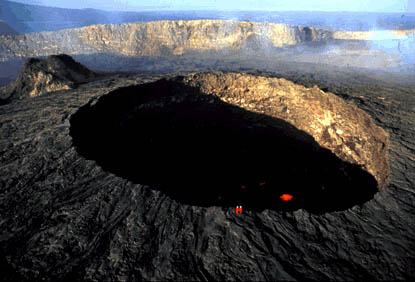 Erta Ale, a shield volcano and caldera in the Afar Triangle.
|
 |
EMORB to slightly alkaline cumulate basalt to rhyolite, Erta Ale area, Ethiopia, (Barrat, J.A., et al, 1998, J.V.G.R. 80, 85-100). |
 |
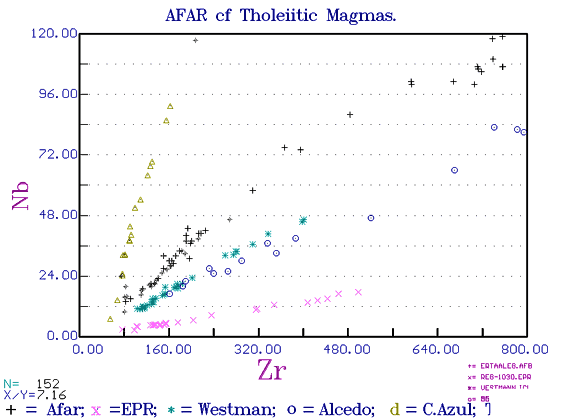
Erta Ale region of AFAR triangle compared with other tholeiitic to mildly alkaline centres.
x = EPR, (Regelous et al, 1999)
o = Alcedo, Galapagos, (Geist, D. et al,1995, J.Pet.36,965-982)
* = Westmanneyjar Is, S. Iceland. (Furman, T et al, 1991, C.M.P.109, 19-37)
+ = Erta Ale area, (Barrat, et al, as above)
Diamonds = Cerro Azul, Gal.Is., (Nauman et al, 2002, J.Pet.43, (5), 859)
Yellow Triangles = partal melt series of Macquarie Id, (Kamanetsky, 2000) Points for Cerro Azul hidden by Erta Atale. |
I believe the Red Sea is classified as a failed spreading centre, at least no spreading appears to be occurring at this time, but as volcanicity is active in the AFAR Triangle in Abyssinia some movement must be taking place there.. As in other slow moving or stagnant spreading zones the basalts recovered are quite alkaline. Haase et al, (2000, Chem. Geol. 166) found E-type MORBS at the northern end, while Volker & Jochum show 4 samples from the south-eastern end to be alkali-basalt as are the coastal basalts on the Arabian side of the Red-Sea.
| |__| |
North-western Red Sea. |
| |__| |
South-eastern Red Sea. |
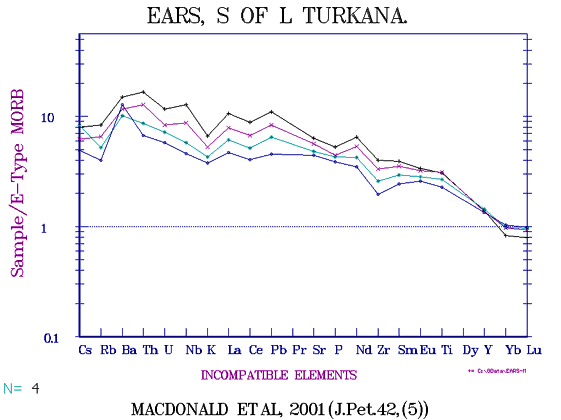
(17) The East African Rift System. (EARS)
This extends from the Danakil Depression in the Afar Triangle with active centres such as Erta Ale, down through Lake Rudolf (Turkana) with assocated lavas of ages back to Miocene, through Lake Navaisha, Mt Kenya etc to the block faulted East Africa , Gregory, or Kenya Rift in which lies Lake Natron, with the 18000ft Mt Kilimanjaro rising fifty miles to the east. A western branch passes through Lake Albert, Lake Kivu and Lake Nyasa with the currently active massive potassic phonolite centres of Sabinyo and Nyiragongo and others. The whole east Africa Rift system does not resemble any other spreading centre, the rocks are highly alkaline ranging from extremely potassic to highly sodic alkali-basalts, basanites etc to carbonatites.
 |
Averaged compositions of lavas along fractured rift system south of Lake Turkana,(Rudolf), (MacDonald et al 2001, J.Pet.(5))
Hypersthene normative basalt; Alkali-olivine basalt; Basanite; Nephelinite. As the averages are so regular, it infers there are effectively no tectonic-related differences in this area. As there is considerable scatter in over 100 single analyses, there may be a sampling problem. I do not believe we can confidently say the EARs IS a spreading centre and it will be discussed in detail elsewhere uner "Continental OIBs". |
(18) Submarine Lava Plateaux
There are several submarine plateaux built up from very large effusions of lava apparently in a very short time. Data from the Ontong Java Plateau shows a very limited range of MORBs between N-type and E-type, somewhat altered with erratic K, Rb, Cs. No negative Nb anomaly is present. This suggests that submarine flood basalts are generated in a volume of upper mantle of different composition to that found under the continents.
|__| The Ontong Java Plateau.
Conclusions
As we have seen, the NMORBs - EMORBs appear to be a continuous series of differing degrees of partial melt of the mantle at a quite small range of pressures upon which are superimposed crystal fractionation effects. The higher degree of melt NMORBs, are by far the most common. The initial melt composition of the basalts is dictated by a low temperature eutectic point and except for the very small degree-of-melt rocks ( ~1%) which have progressively higher Al2O3, there is little difference in their SiO2, (MgO+FeOT), Al2O3, and CaO, neither are these elements much affected by the rather small degree of crystal fractionation normally encountered, MgO seldom having a range greater than 3, ie, about 3-9% and usually much less (7-9%) and while iron may range from 9 up to 18%, the ferro-basalts rarely found outside the EPR. A single rhyodacite with only 5% FeT is also known from the EPR.
The main "Stem" of the partial melt trend however is steeper than the fractionation trend for most residual elements, so that Nb can range from < 7 ppm to about 100 ppm for example, while La ranges from < 5 - ~50ppm. In the Macquarie parental melt series alone (though more depleted extreme variations are known to exist), U varies by a factor of 20, (figures rounded); Ba by 15, Cs x 14; Rb x 10, Th x 8; Pb x6; Be x 4; Bo x 3; (Kamanetsky et al, 2000)
From every member of the primary melt stem, fractionated rocks diverge sharply, sometimes almost at right angles to the parental trend near the base of the stem but becoming more acute upwards when LILE are plotted against HFSE, (eg La/Lu or Rb/Y) but LILE plotted together branch off at a quite acute angle throughout as seen in K/Rb or Th/U. When two HFSE are plotted for the primary melts and for a fractionated series (eg Y/Lu), they lie on or very near the same flat trend, the range for the melt series being very minimal (20-25 ppm for Y) while those for the fractionated rocks , eg for the EPR, being of much greater spread, up to 120ppm
In the rare highly fractionated oceanic basalts such as seen in the EPR, the fractionated "side branches" may show as great or even wider range than the melt series, eg Rb x 10; U x 10; La x 7; Nb x 6; Zr x 6.5; Y x 4.5; and Lu x 4.
It is most important to note that while the HFSE (Y, Lu etc) remain almost constant over the range of parental melts, they may show a considerable increase with fractionation, at least half that shown by the LILE Rb, Ba, Nb etc. This makes distinguishing primary melt series from fractionated series a simple matter, a Y/Nb, Lu/La or Y/Rb plot shows the two trends at right-angles to each-other, as shown above.
Ratios between any element pairs remain almost constant in all fractionated series and are apparently the same as the parental magma at the point on the stem where the fractionates originated. So we should be able to take a single fractionated sample of known, say, Zr/Nb, project back on to the main stem the point from which it must have originated (knowing the slope of the fractionated series) and then write down it's probable La/Lu, Nb/Nd etc. and even its residual element composition by measuring the distance up the fractionation branch. Before this can be thoroughly proved we need data from more fractionated series especially those stemming from the more enriched melts. Also much more depleted High-degree partial melts exist. Do they continue on the same Macquarie linear line or do they suddenly break towards olivine as Hawaii and Reunion do? The most depleted MORBs from Kolbeinsey Ridge show an olivine trend but some of the samples are whole rocks, not glasses. The more depleted NMORBs of Niu and Batiza (1999) do show a break towards high Mg in the most basic samples.
Defining the plane of partial melts has been greatly helped by the use of glass samples, cumulates being excluded. It is much more difficult to define a similar stem for alkali basalts melted at higher pressures because of lack of glass samples, we do not know where melts end and cumulates begin. It seems as though the more alkaline rocks have a stem more enriched in both HFSE and LILE, while some very depleted MORBs eg, Kolbeinsey Ridge, for some elements appears come from a stem more depleted in HFSE than Macquarie Id., but as already said there is no pure olivine trend present.
One can only hope from the completely random sampling that has been carried out so far we can now select areas which may fill in gaps, especially the slowest or now stationary spreading centres, and those which are the fastest.
HOME
Copyright © 1998-2006 Dr B.M.Gunn
|